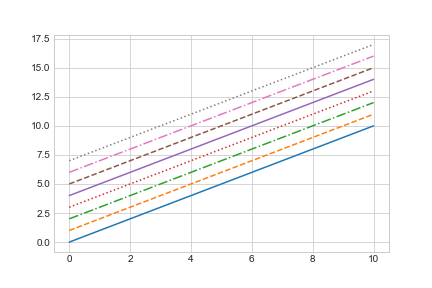
Loading... <div class="tip inlineBlock warning"> 本文章内,部分代码可能来自于互联网,如有侵权,请在评论区回复! </div> ## 导入matplotlib ```python import matplotlib as mpl import matplotlib.pyplot as plt ``` ## 开始! ### 设置线条颜色 ```python plt.plot(x, np.sin(x - 0), color='blue') # 通过颜色名字 plt.plot(x, np.sin(x - 1), color='g') # 颜色代码 plt.plot(x, np.sin(x - 2), color='0.75') # 灰度值 plt.plot(x, np.sin(x - 3), color='#FFDD44') # 十六进制 plt.plot(x, np.sin(x - 4), color=(1.0,0.2,0.3)) # RGB元组 plt.plot(x, np.sin(x - 5), color='chartreuse'); # HTML颜色名称 ```  ### 顺便说一下保存方法 ```python plt.savefig('name.png') ``` ### 线条风格 ```python plt.plot(x, x + 4, linestyle='-') # 实线 plt.plot(x, x + 5, linestyle='--') # 虚线 plt.plot(x, x + 6, linestyle='-.') # 点横线 plt.plot(x, x + 7, linestyle=':'); # 点线 ```  ## 总结 本次小节,主要就是实践了一下matplotlib的一些基本操作。。。 一根针,已经插了进去。 Last modification:June 13, 2021 © Allow specification reprint Support Appreciate the author AliPayWeChat Like 如果觉得我的内容对你有用,请随意赞赏
One comment